Free Access
Fig. 5
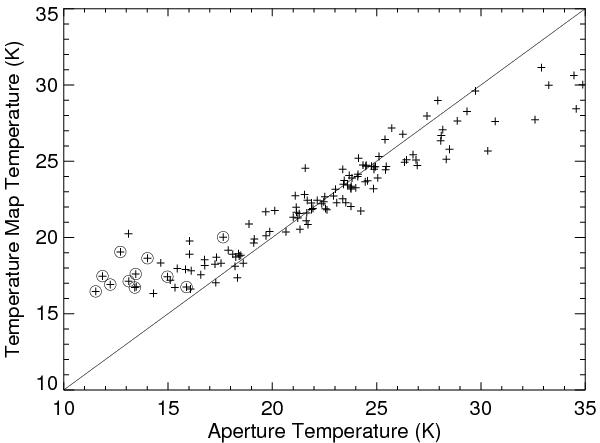
The temperature derived using aperture photometry versus the average temperature in the temperature map derived using the same apertures. The line is not a fit but rather shows a 1:1 relationship. The circled sources are IRDCs from the field of RCW 120; they account for much of the difference at low temperature.
Current usage metrics show cumulative count of Article Views (full-text article views including HTML views, PDF and ePub downloads, according to the available data) and Abstracts Views on Vision4Press platform.
Data correspond to usage on the plateform after 2015. The current usage metrics is available 48-96 hours after online publication and is updated daily on week days.
Initial download of the metrics may take a while.