Free Access
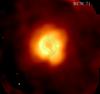
Fig. 4
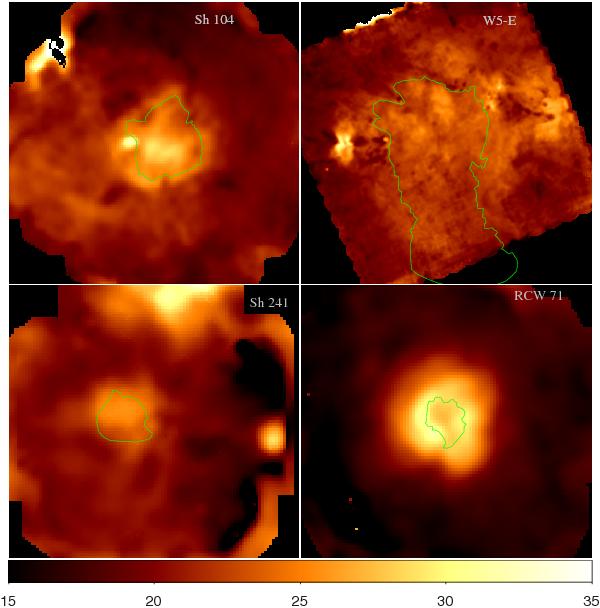
Temperature maps created by fitting the SEDs extracted at a grid of locations. All panels have the same color scale and range from 15 K to 35 K. The green curves show the approximate extent of the bubble interiors.
This figure is made of several images, please see below:

Current usage metrics show cumulative count of Article Views (full-text article views including HTML views, PDF and ePub downloads, according to the available data) and Abstracts Views on Vision4Press platform.
Data correspond to usage on the plateform after 2015. The current usage metrics is available 48-96 hours after online publication and is updated daily on week days.
Initial download of the metrics may take a while.