Free Access
Fig. 14
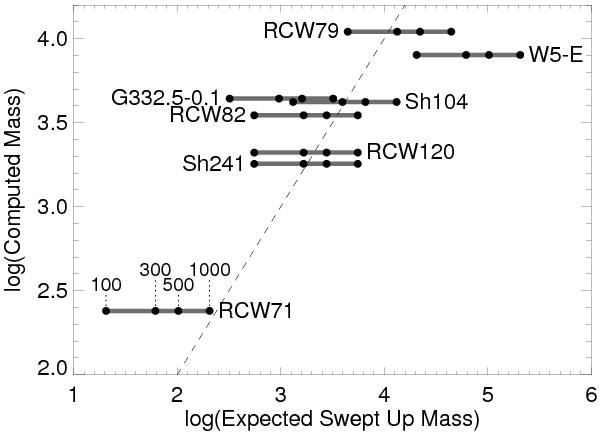
The expected swept up mass versus the calculated mass for the eight bubble regions. The expected mass is computed for initial ambient densities from 100 to 1000 cm-3, assuming all material overtaken by the ionization front is now contained in the PDR of the region. The dashed line shows a one-to-one relationship.
Current usage metrics show cumulative count of Article Views (full-text article views including HTML views, PDF and ePub downloads, according to the available data) and Abstracts Views on Vision4Press platform.
Data correspond to usage on the plateform after 2015. The current usage metrics is available 48-96 hours after online publication and is updated daily on week days.
Initial download of the metrics may take a while.