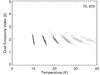
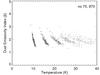
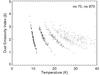
Fig. 11
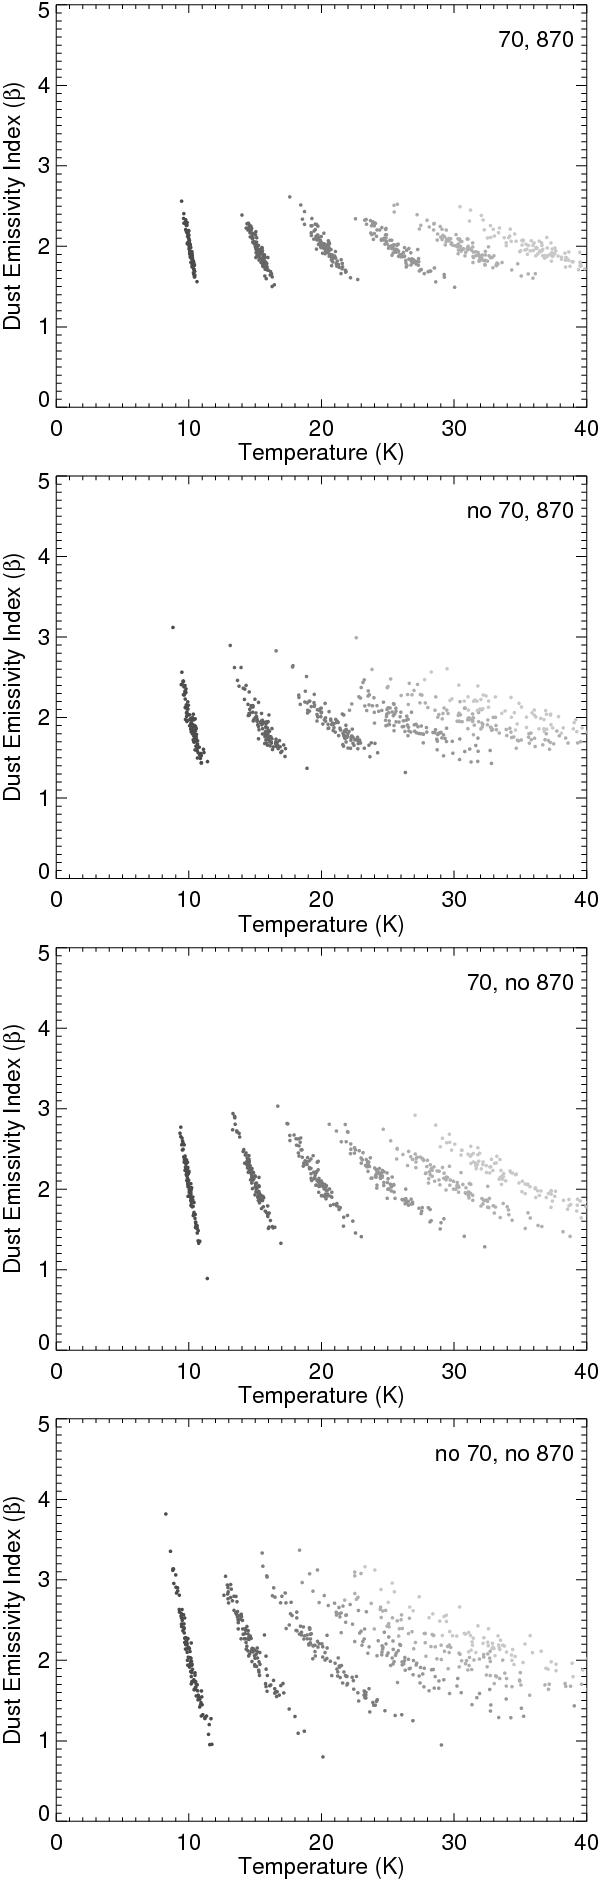
Fits of Td and β using simulated data. Each data point is the result of an SED fit to simulated data accounting for calibration and photometric uncertainties. The simulated SEDs were created with input temperature values from 10 to 35 K in steps of 5 K and β = 2.0. Points with a common input temperature share a common shade of gray.
Current usage metrics show cumulative count of Article Views (full-text article views including HTML views, PDF and ePub downloads, according to the available data) and Abstracts Views on Vision4Press platform.
Data correspond to usage on the plateform after 2015. The current usage metrics is available 48-96 hours after online publication and is updated daily on week days.
Initial download of the metrics may take a while.