Fig. 10
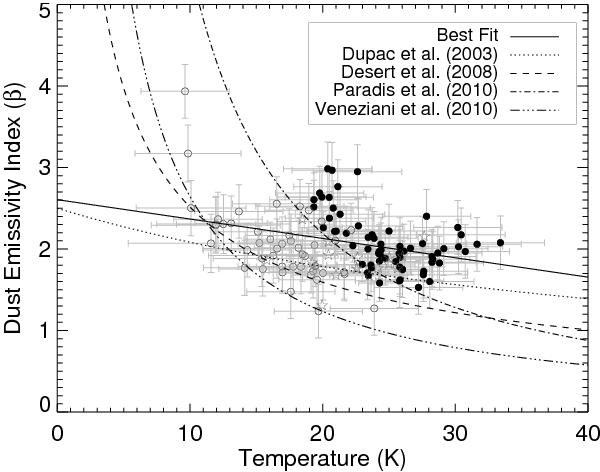
The β − Td relationship derived from the aperture photometry. Data points from the “warm” group are shown with filled circles while those from the “cold” group are shown with open circles. Data points from “PS” apertures are shown with star symbols. We plot on top of the data the best fit line as well as the best fits lines found by Dupac et al. (2003), Désert et al. (2008), Paradis et al. (2010), and Veneziani et al. (2010).
Current usage metrics show cumulative count of Article Views (full-text article views including HTML views, PDF and ePub downloads, according to the available data) and Abstracts Views on Vision4Press platform.
Data correspond to usage on the plateform after 2015. The current usage metrics is available 48-96 hours after online publication and is updated daily on week days.
Initial download of the metrics may take a while.