Fig. 8
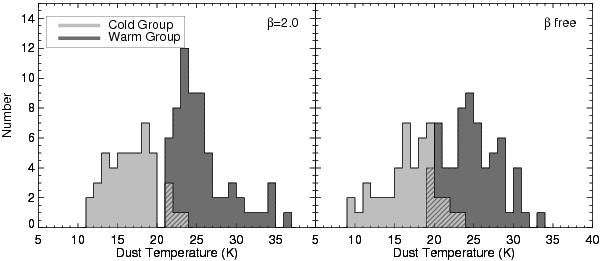
Dust temperatures of warm and cold aperture groups. Shown are the distributions for the apertures in the cold group (“Filament” and “IRDC” classifications) in light gray and the apertures in the warm group (“Entire”, “Other H II”, and “PDR” classifications) in dark gray. We do not include in this figure apertures with classification “PS”. Where the two distributions overlap, we show light gray with dark gray hatching. The left panel shows dust temperatures derived when β was held fixed to a value of 2.0 while the right panel shows the dust temperatures derived when β was allowed to vary. It is evident that these two aperture groups have different dust temperature distributions.
Current usage metrics show cumulative count of Article Views (full-text article views including HTML views, PDF and ePub downloads, according to the available data) and Abstracts Views on Vision4Press platform.
Data correspond to usage on the plateform after 2015. The current usage metrics is available 48-96 hours after online publication and is updated daily on week days.
Initial download of the metrics may take a while.