Fig. 7
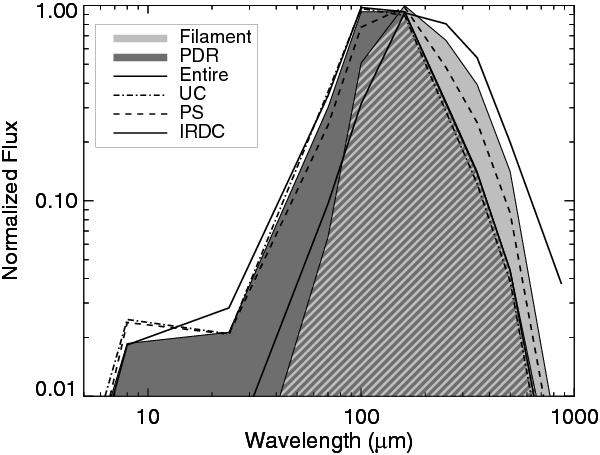
The average normalized SEDs for the aperture classes. Results from the “PDR” class are shown in dark gray while those in the “Filament” class are shown in light gray. Where the two “PDR” and “Filament” distributions overlap, we show light gray with dark gray hatching. Lines show the average normalized SEDs for the “Entire”, Other “HII”, “PS”, and “IRDC” classes; the “IRDC” class SED is similar to that of the “Filament” class while the SEDs of the “Entire”, and “Other H II” classes are more similar to that of the “PDR” class. The “PS” class has a mean SED shape in between that of the “PDR” and “Filament” classes. The points at 8.0 μm and 24 μm are shown here although these data were not used in the fits.
Current usage metrics show cumulative count of Article Views (full-text article views including HTML views, PDF and ePub downloads, according to the available data) and Abstracts Views on Vision4Press platform.
Data correspond to usage on the plateform after 2015. The current usage metrics is available 48-96 hours after online publication and is updated daily on week days.
Initial download of the metrics may take a while.