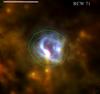
Fig. 1
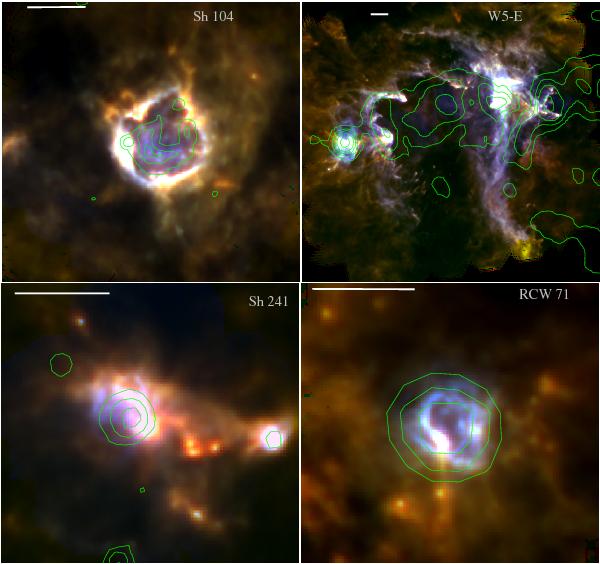
Three-color Herschel images for the eight observed regions. For each source the 500 μm data are shown in red, the 250 μm data in green, and the 100 μm data in blue. The images are oriented in RA and Dec such that north is up and east is left. The white scale bar in the upper left corner is 5′ in length. The coldest regions in each field appear red while the warmest appear blue. Contours show radio continuum emission from the NVSS (for Sh 104, Sh 241, and RCW 120), SUMSS (for RCW 79, RCW 82, and G332) or GB6 (for W5-E and RCW 71).
Current usage metrics show cumulative count of Article Views (full-text article views including HTML views, PDF and ePub downloads, according to the available data) and Abstracts Views on Vision4Press platform.
Data correspond to usage on the plateform after 2015. The current usage metrics is available 48-96 hours after online publication and is updated daily on week days.
Initial download of the metrics may take a while.