Fig. 8
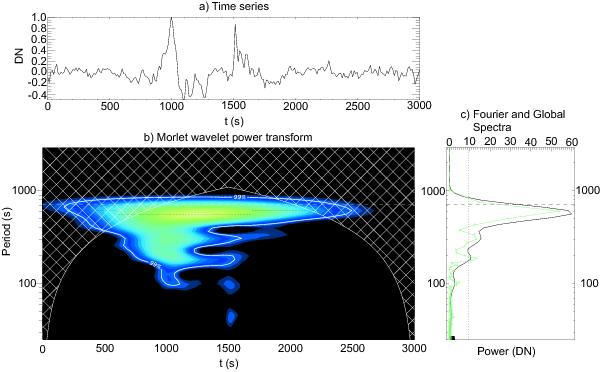
a) The time series for the normalised intensity in 171 Å located at 10 arcsec in cross-cut No. 2 shown in Fig. 4. The time is measured in seconds from 09:00 UT on 20 January 2011. b) The wavelet plot for the time series with regions of significant power (>99%) contoured with the white line. The coloured regions show power above 95%. c) The Fourier and global powers spectra for the analysed time series.
Current usage metrics show cumulative count of Article Views (full-text article views including HTML views, PDF and ePub downloads, according to the available data) and Abstracts Views on Vision4Press platform.
Data correspond to usage on the plateform after 2015. The current usage metrics is available 48-96 hours after online publication and is updated daily on week days.
Initial download of the metrics may take a while.