Free Access
Fig. 7
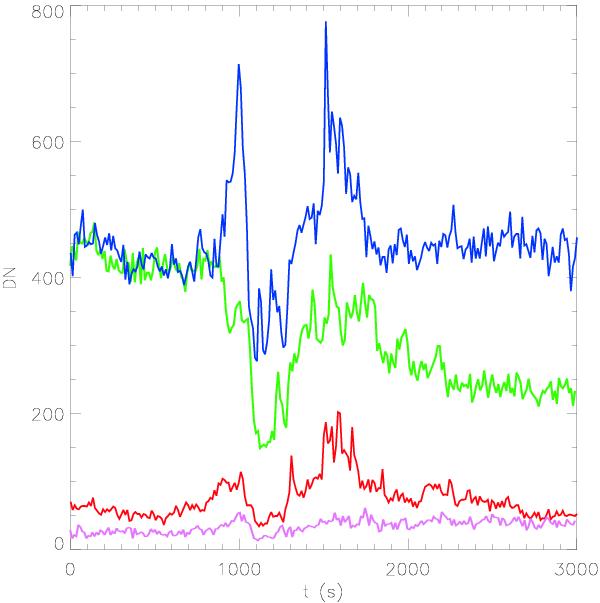
The flux as a function of time for the pixel located at 10 arcsec along bright feature No. 2 in Fig. 4. The red, blue, green and purple lines corresponds to the 304 Å, 171 Å, 193 Å and 131 Å time series, respectively. The time series are shown from 09:00 UT to 09:48 UT.
Current usage metrics show cumulative count of Article Views (full-text article views including HTML views, PDF and ePub downloads, according to the available data) and Abstracts Views on Vision4Press platform.
Data correspond to usage on the plateform after 2015. The current usage metrics is available 48-96 hours after online publication and is updated daily on week days.
Initial download of the metrics may take a while.