Fig. 6
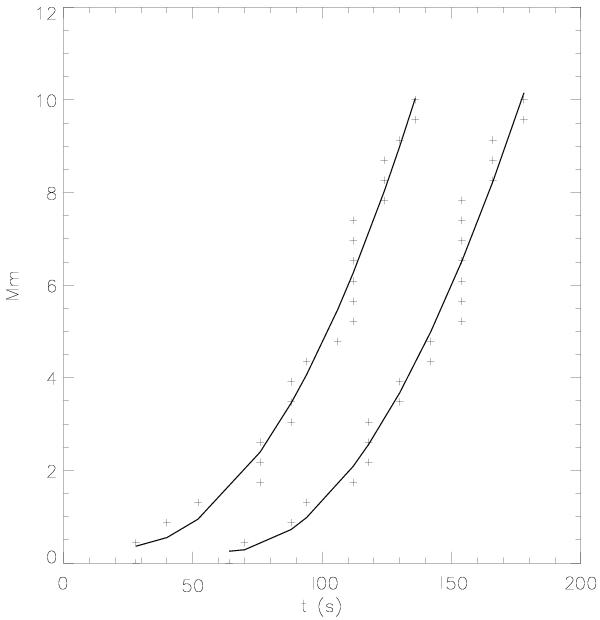
Examples of the tracks made by the bright ejecta seen in the time-distance plots. The crosses represent the points of maximum intensity along the track and the solid line is a cubic polynomial fitted to the data points. The time referred to in this plot is unrelated to the large jet phenomena and should only be used in relation to the properties of the ejecta, i.e. lifetimes, velocities.
Current usage metrics show cumulative count of Article Views (full-text article views including HTML views, PDF and ePub downloads, according to the available data) and Abstracts Views on Vision4Press platform.
Data correspond to usage on the plateform after 2015. The current usage metrics is available 48-96 hours after online publication and is updated daily on week days.
Initial download of the metrics may take a while.