Free Access
Fig. 2
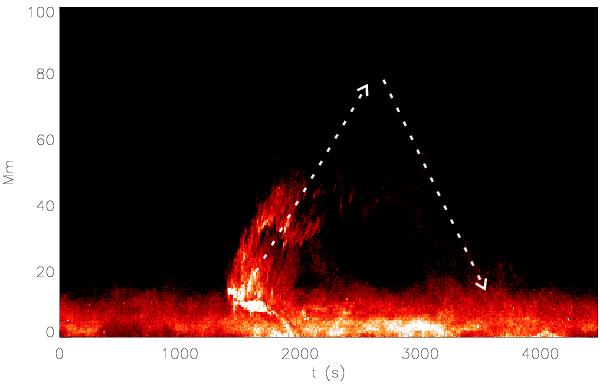
Time-distance plot from the cross-cut along the jet axis shown in Fig. 1d, demonstrating the evolution of the plasma curtain. The arrows mark out the paths used to calculate the average up-flow and down-flow speeds of the plasma curtain.
Current usage metrics show cumulative count of Article Views (full-text article views including HTML views, PDF and ePub downloads, according to the available data) and Abstracts Views on Vision4Press platform.
Data correspond to usage on the plateform after 2015. The current usage metrics is available 48-96 hours after online publication and is updated daily on week days.
Initial download of the metrics may take a while.