Fig. 6
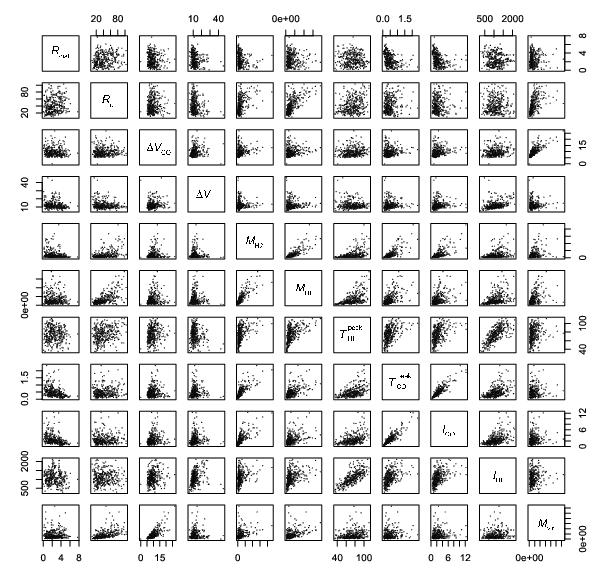
Plots of all the pair combinations between the cloud properties to show how they correlate. Each point in each plot represents one of the 337 clouds in the sample. For each plot, the x-axis corresponds to the parameter on the diagonal for the same column and the y-axis to the parameter on the diagonal for the same line. For example, the plot in the eighth column and fifth row shows the cloud mass as derived from the CO luminosity (“MH2” – see Table A.1) as a function of the peak CO line temperature (“ ”) and the scales can be read at the top of the column for the x-axis and at the right end of the row for the y-axis. For odd columns and even row numbers, the scales are respectively to the bottom and left. The units for each quantity are given in Table A.1.
Current usage metrics show cumulative count of Article Views (full-text article views including HTML views, PDF and ePub downloads, according to the available data) and Abstracts Views on Vision4Press platform.
Data correspond to usage on the plateform after 2015. The current usage metrics is available 48-96 hours after online publication and is updated daily on week days.
Initial download of the metrics may take a while.