Fig. 5
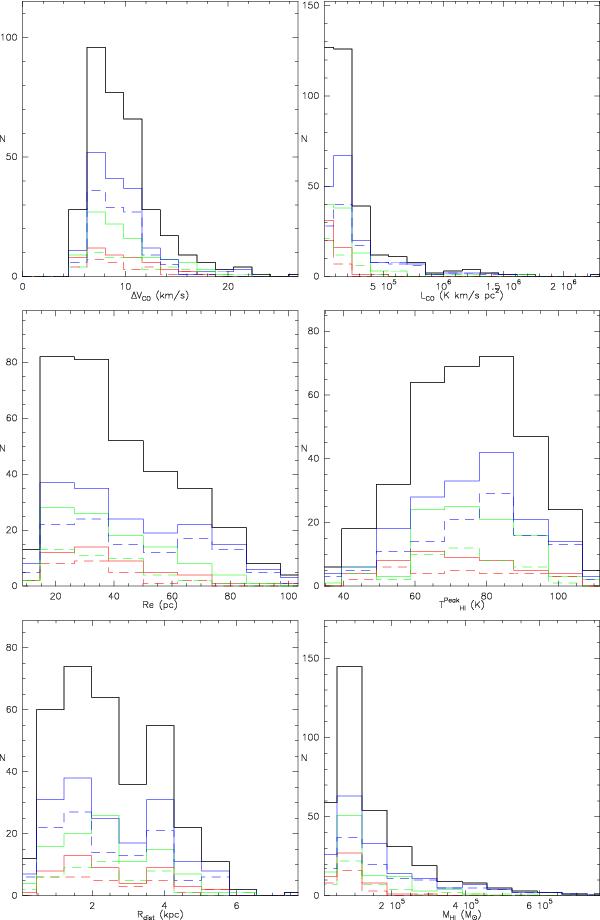
Histograms of the GMC properties. From left to right and top to bottom: CO(2–1) FWHM, molecular gas mass from CO(2–1), effective radius, peak H i temperature, galactocentric radius, atomic gas mass. In each panel, the thick black line corresponds to the whole cloud sample, the red line to type A clouds, the green line to type B clouds, and the blue line to type C clouds. The solid and dashed versions of each color correspond respectively to no thresholding and a 0.7 probability thresholding for the clouds (see details in text).
Current usage metrics show cumulative count of Article Views (full-text article views including HTML views, PDF and ePub downloads, according to the available data) and Abstracts Views on Vision4Press platform.
Data correspond to usage on the plateform after 2015. The current usage metrics is available 48-96 hours after online publication and is updated daily on week days.
Initial download of the metrics may take a while.