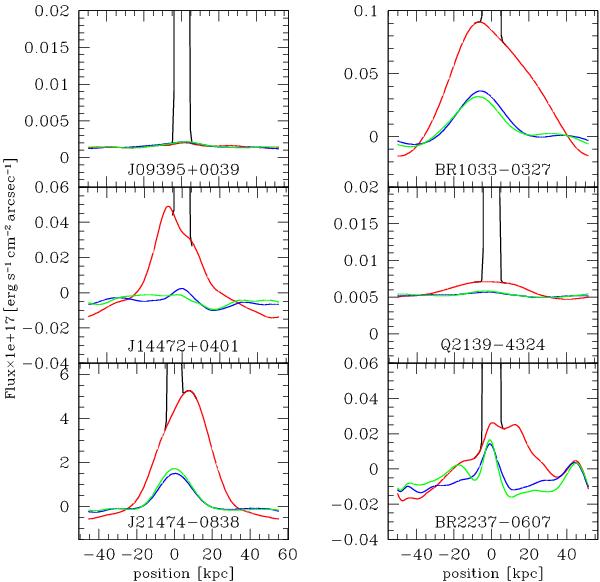
Fig. 3

Spatial profiles of the envelopes. The black, quasi-vertical lines show the intensity profile of the quasar, while the red line is the intensity profile of the envelope, integrated across the spectral width of the Lyα line (i.e. an arbitrary range of 20 Å for objects with no significant envelope, and a 1 × FWHM for the other objects). The blue and green lines show the noise, i.e. the profile integrated across wavelength ranges of the same width, but centred 76 Å bluer, respectively redder than the envelope emission line (except for BR 2237 − 0607, for which the noise was sampled at ± 29 Å from the emission line).
Current usage metrics show cumulative count of Article Views (full-text article views including HTML views, PDF and ePub downloads, according to the available data) and Abstracts Views on Vision4Press platform.
Data correspond to usage on the plateform after 2015. The current usage metrics is available 48-96 hours after online publication and is updated daily on week days.
Initial download of the metrics may take a while.


