Free Access
Fig. 2
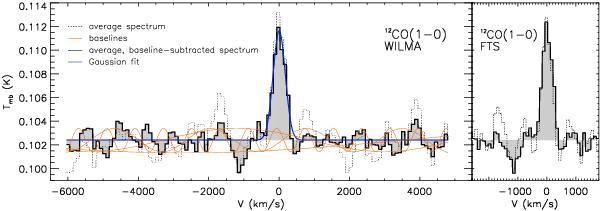
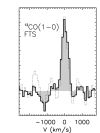
WILMA (left) and FTS (right) 12CO(1−0) spectrum of 4C 12.50, binned to 93 km s-1 channels. The dashed histogram corresponds to the average spectrum prior to the removal of sinusoidal baselines, which represent the harmonics of a standing wave (shown in orange). The final spectrum is shown as a solid, filled histogram.
This figure is made of several images, please see below:
Current usage metrics show cumulative count of Article Views (full-text article views including HTML views, PDF and ePub downloads, according to the available data) and Abstracts Views on Vision4Press platform.
Data correspond to usage on the plateform after 2015. The current usage metrics is available 48-96 hours after online publication and is updated daily on week days.
Initial download of the metrics may take a while.