Fig. 1
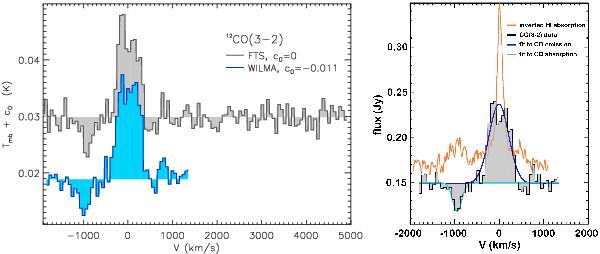
Left: FTS and WILMA spectra of 12CO(3−2) in 4C 12.50, binned into 62 km s-1 channels and shifted by a constant c0, when needed. Right: flux-calibrated line profile of 12CO(3−2) , averaged over the WILMA and the FTS data to be least affected by potential artifacts. Gaussian functions with parameters that most closely fit the emission component at the systemic velocity and the absorption component at −950 km s-1 are shown in blue and cyan, respectively. The inverse H i absorption that is seen in the radio data of 4C 12.50 (Morganti et al. 2004) is overplotted in orange for an arbitrary scale and continuum level.
Current usage metrics show cumulative count of Article Views (full-text article views including HTML views, PDF and ePub downloads, according to the available data) and Abstracts Views on Vision4Press platform.
Data correspond to usage on the plateform after 2015. The current usage metrics is available 48-96 hours after online publication and is updated daily on week days.
Initial download of the metrics may take a while.