Fig. 3
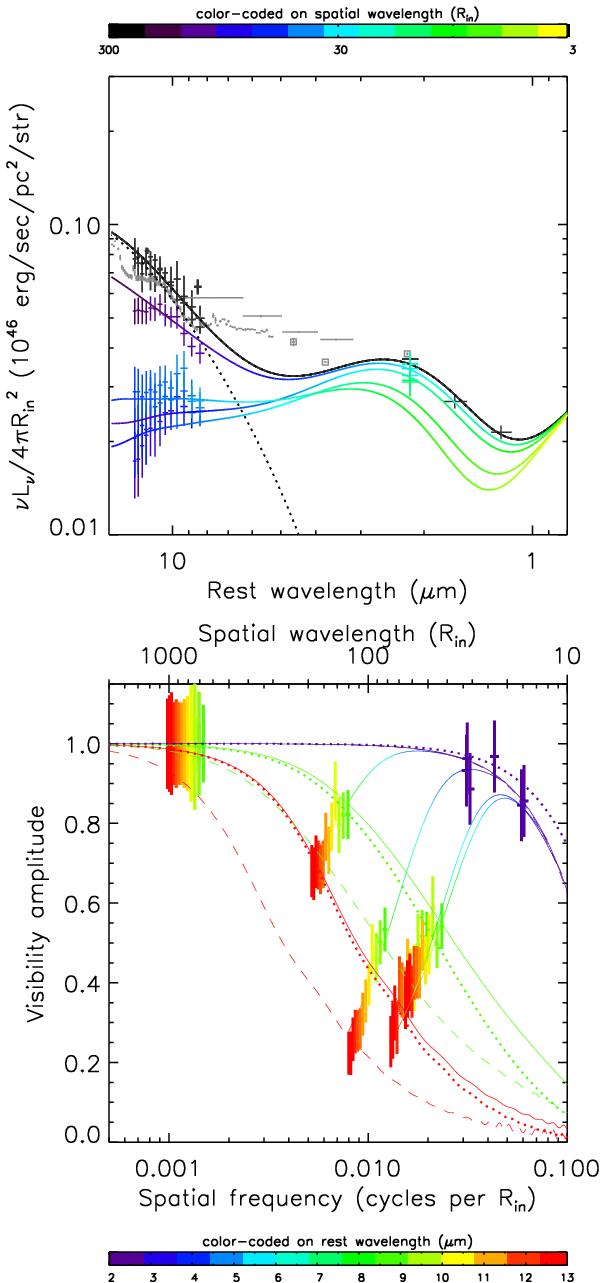
Temperature/density-gradient model including an additional inner hot 1400 K ring component. Top: SED observations (black and gray symbols), model SEDs (black solid line: model including the 1400 K ring component; black dotted line: model without the 1400 K component), and correlated fluxes (yellow, green, and blue; see Paper I for more details). The different colors (see top color bar) correspond to different spatial wavelengths measured in units of the dust sublimation radius Rin. Bottom: new NIR visibilities (purple symbols) and our MIR visibilities from Paper I (the symbols with colors from green to red correspond to 8.5 to 13 μm; see color-coding bar; note that the spatial frequency is given in units of cycles per Rin). The solid and dashed lines are the visibilities of the temperature/density-gradient model including an additional inner 1400 K ring. The red, green, and purple lines are the model visibilities at 13, 8.5, and 2.2 μm, respectively (solid lines: model curves for the PA along the equatorial axis; dashed line: along the polar direction; see Paper I). The dotted lines are the visibilities and SED of the same temperature/density-gradient model, but without an inner hot 1400 K ring component.
Current usage metrics show cumulative count of Article Views (full-text article views including HTML views, PDF and ePub downloads, according to the available data) and Abstracts Views on Vision4Press platform.
Data correspond to usage on the plateform after 2015. The current usage metrics is available 48-96 hours after online publication and is updated daily on week days.
Initial download of the metrics may take a while.