Fig. 4
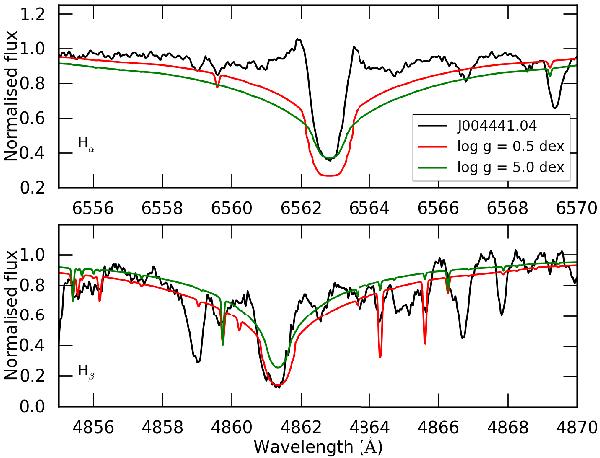
Comparison between Balmer lines of J004441.04 with synthetic models of Coelho et al. (2005) with different log g. The upper panel shows Hα, the lower panel shows Hβ. The black spectrum represents J004441.04, the red and green spectrum are synthetic spectra with a log g of 0.5 and 5.0 dex respectively. For more information, see text.
Current usage metrics show cumulative count of Article Views (full-text article views including HTML views, PDF and ePub downloads, according to the available data) and Abstracts Views on Vision4Press platform.
Data correspond to usage on the plateform after 2015. The current usage metrics is available 48-96 hours after online publication and is updated daily on week days.
Initial download of the metrics may take a while.