Fig. 16
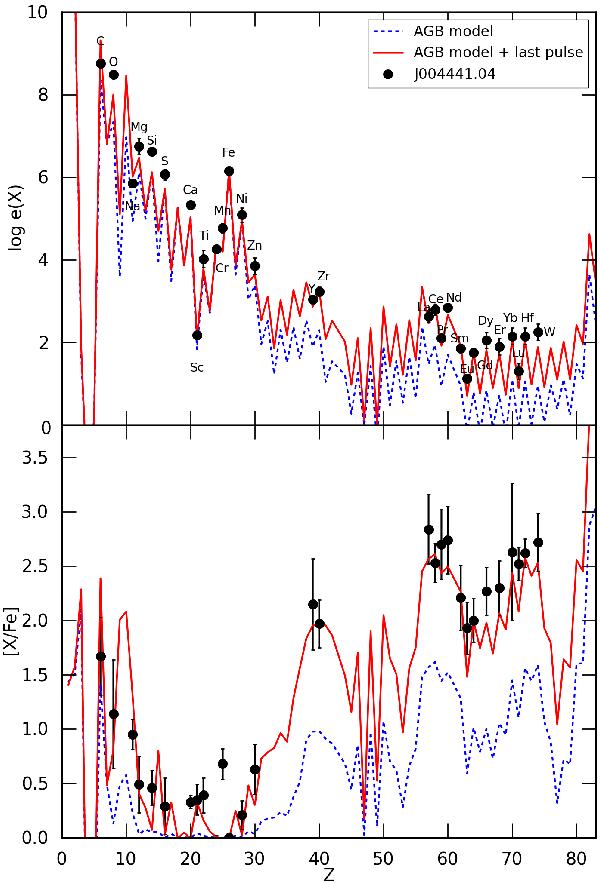
Predicted elemental distribution in log ϵ (top) and [X/Fe] (bottom panel) as a function of the atomic number Z for a 1.3 M⊙, [Fe/H] = –1.4 model computed with STAREVOL. In each panel, the blue-dashed line corresponds to the post-processed AGB model including 15 thermal pulses and the red line shows the results expected from the occurrence of an additional final thermal pulse followed by a deep TDU.
Current usage metrics show cumulative count of Article Views (full-text article views including HTML views, PDF and ePub downloads, according to the available data) and Abstracts Views on Vision4Press platform.
Data correspond to usage on the plateform after 2015. The current usage metrics is available 48-96 hours after online publication and is updated daily on week days.
Initial download of the metrics may take a while.