Fig. 1
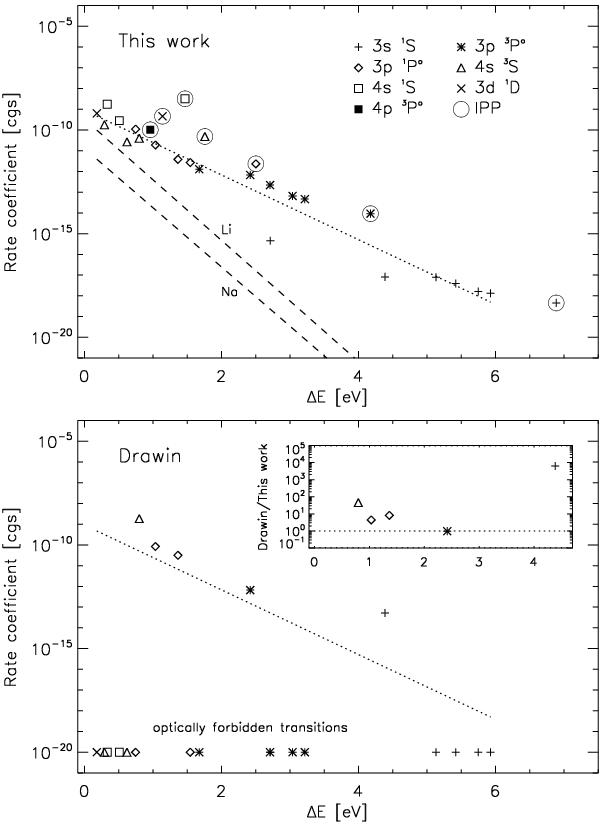
Rate coefficients at 6000 K for excitation and ion-pair production processes in Mg+H collisions, plotted against the transition energy ΔE. Different symbols are used to denote the initial state of the transition following the key given in the upper panel. The upper panel shows the results from this work based on detailed quantum scattering calculations (Belyaev et al. 2012). Symbols inside circles refer to ion-pair production processes (IPP); i.e. the final state is the ionic state Mg+(3s 2S)+H−. The dotted line shows a linear fit to the data for excitation processes (i.e. excluding ion-pair production), which is repeated in the lower panel to aid comparison. The dashed lines show the fits to the corresponding data for Li and Na from Barklem et al. (2011). The lower panel shows the results of the Drawin formula, and the inset shows the ratio with the quantum scattering calculations. Optically forbidden transitions, where the Drawin formula is not applicable, are shown in the bottom of the panel.
Current usage metrics show cumulative count of Article Views (full-text article views including HTML views, PDF and ePub downloads, according to the available data) and Abstracts Views on Vision4Press platform.
Data correspond to usage on the plateform after 2015. The current usage metrics is available 48-96 hours after online publication and is updated daily on week days.
Initial download of the metrics may take a while.