Fig. 1
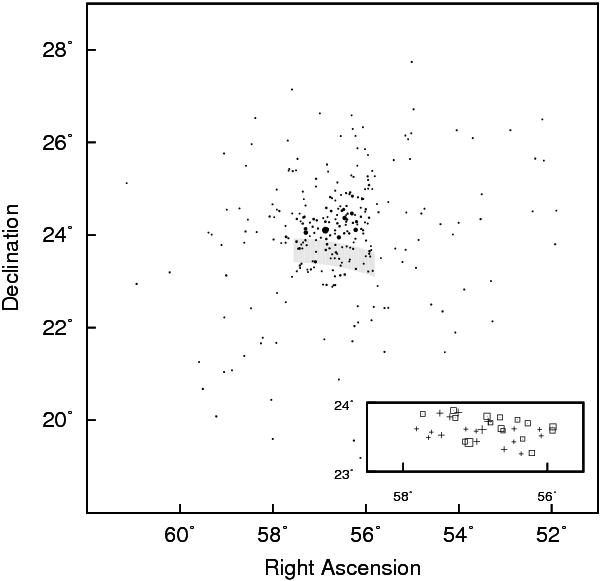
Spatial distribution of the Pleiades cluster members having K ≤ 10 mag (from Stauffer et al. 2007), with dots proportional to the K-band brightness. The shaded area shows the path of the Moon during the time covered by our occultation events (only N-S segments through the Moon center are plotted, not its actual circular outline). The inset shows the position of the occulted sources, where cluster members are marked with squares and field stars with crosses.
Current usage metrics show cumulative count of Article Views (full-text article views including HTML views, PDF and ePub downloads, according to the available data) and Abstracts Views on Vision4Press platform.
Data correspond to usage on the plateform after 2015. The current usage metrics is available 48-96 hours after online publication and is updated daily on week days.
Initial download of the metrics may take a while.