Fig. 8
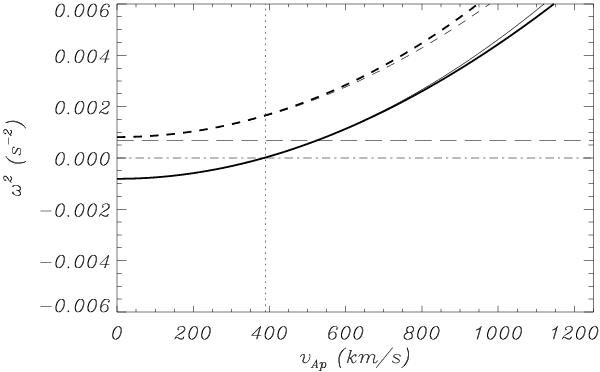
Square of the frequency as a function of the Alfvén speed in the thread. In this plot R = 3.3 × 10² km, λ = 1.2 × 10⁵ km and  . The same notation as in the previous figures has been used. The long dashed line corresponds to the frequency (P = 4 min) derived from the observations of Okamoto et al. (2007). The dashed lines correspond to the C + solution while the solid lines represent the C − solution.
Current usage metrics show cumulative count of Article Views (full-text article views including HTML views, PDF and ePub downloads, according to the available data) and Abstracts Views on Vision4Press platform.
Data correspond to usage on the plateform after 2015. The current usage metrics is available 48-96 hours after online publication and is updated daily on week days.
Initial download of the metrics may take a while.