Fig. 4
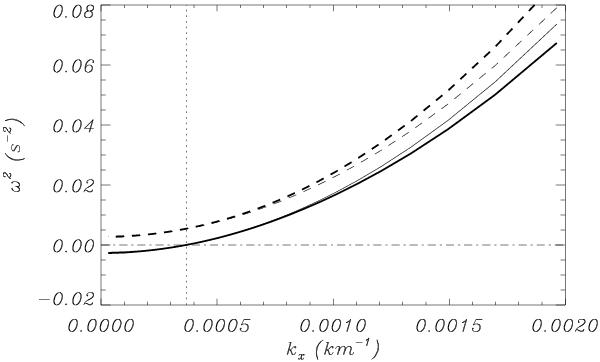
Square of the frequency as a function of kx. In this plot R = 102 km, ρp = 100ρc, and vAp = 100 km s-1. Thick lines correspond to the full dispersion relation for the slab (Eq. (22)), while thin lines represent the solutions of the single interface (Eq. (17)). The dashed lines correspond to the C + solution while the solid lines represent the C − solution.The dotted vertical line represents the critical wavenumber calculated using Eq. (32).
Current usage metrics show cumulative count of Article Views (full-text article views including HTML views, PDF and ePub downloads, according to the available data) and Abstracts Views on Vision4Press platform.
Data correspond to usage on the plateform after 2015. The current usage metrics is available 48-96 hours after online publication and is updated daily on week days.
Initial download of the metrics may take a while.