Free Access
Fig. 3
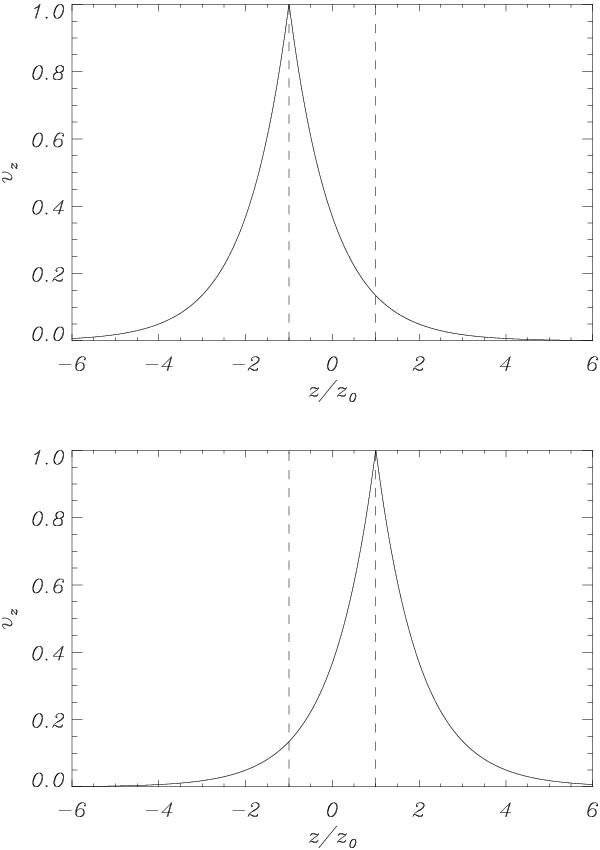
Eigenfunction of the modes associated to the lower unstable mode (top panel) and upper stable mode (bottom panel) in the purely gravitational case. In this plot R = 102 km, λ = 2 × 10⁵ km, ρp = 100ρc and vAp = 0 (g = 0.274 km s-2). The dashed lines represent the slab boundaries.
This figure is made of several images, please see below:
Current usage metrics show cumulative count of Article Views (full-text article views including HTML views, PDF and ePub downloads, according to the available data) and Abstracts Views on Vision4Press platform.
Data correspond to usage on the plateform after 2015. The current usage metrics is available 48-96 hours after online publication and is updated daily on week days.
Initial download of the metrics may take a while.