Free Access
Fig. 5
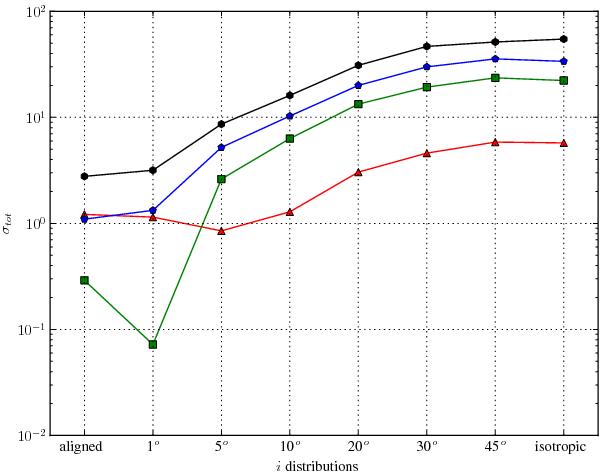
Distance between Kepler point and the result from each simulation, measured in σ’s; the triangle, square, pentagon, and hexagon (red, green, blue, and black in electronic version only) represent the results for the 5, 7, 9, and 10 M⊕ cutoffs in msini, respectively.
Current usage metrics show cumulative count of Article Views (full-text article views including HTML views, PDF and ePub downloads, according to the available data) and Abstracts Views on Vision4Press platform.
Data correspond to usage on the plateform after 2015. The current usage metrics is available 48-96 hours after online publication and is updated daily on week days.
Initial download of the metrics may take a while.