Fig. 4
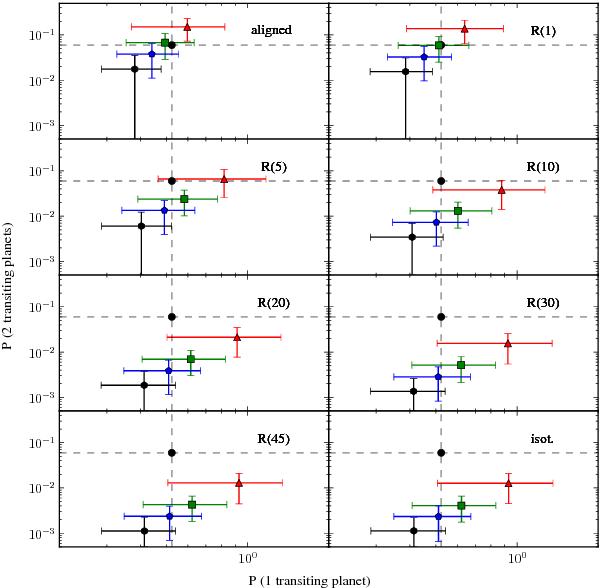
Result of the simulations with the methodology described in 4.1 for the different i distributions considered. The figure depicts the match between the frequency of single and double transiting systems obtained from our simulations and Kepler results. In each plot the black circle represents Kepler results and the triangle, square, pentagon, and hexagon (red, green, blue, and black in electronic version only) represent the results for the 5, 7, 9, and 10 M⊕ cutoffs in msini; the error bars result from the application of the 1-σ uncertainties. The different subpanels represent the application of different i distributions, from left to right and top to bottom: aligned, R(1°), R(5°), R(10°), R(20°), R(30°), R(45°), and isotropic, respectively.
Current usage metrics show cumulative count of Article Views (full-text article views including HTML views, PDF and ePub downloads, according to the available data) and Abstracts Views on Vision4Press platform.
Data correspond to usage on the plateform after 2015. The current usage metrics is available 48-96 hours after online publication and is updated daily on week days.
Initial download of the metrics may take a while.