Free Access
Fig. 4
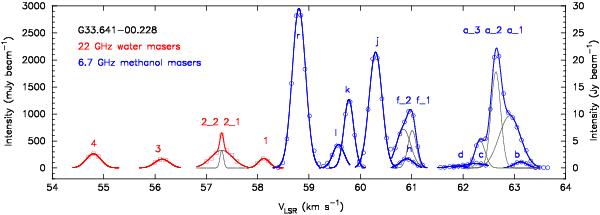
Same as Fig. 2 but for G33.641−00.228. The scale on the left side describes the water maser intensity, while the right side corresponds to the methanol maser intensity. The clouds with only two single spots or without Gaussian characteristic are not marked for the clarity of the figure (i.e., clouds 5, 6, e, g, i, n, p).
Current usage metrics show cumulative count of Article Views (full-text article views including HTML views, PDF and ePub downloads, according to the available data) and Abstracts Views on Vision4Press platform.
Data correspond to usage on the plateform after 2015. The current usage metrics is available 48-96 hours after online publication and is updated daily on week days.
Initial download of the metrics may take a while.