Fig. 7
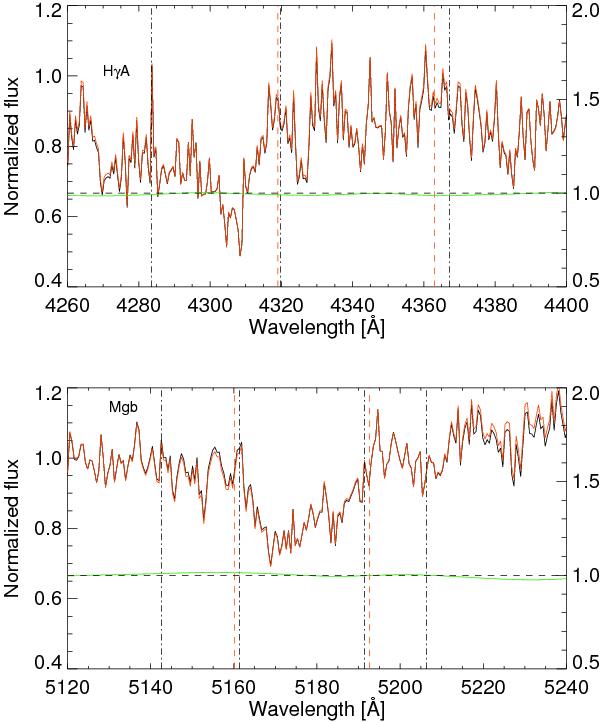
Difference between a spectrum corrected for the fringe-like pattern (red solid line) and a spectrum that was not corrected (black solid line). The green solid line shows the correction function across the wavelength range where the scaling is given at the right y-axis. The line strength is measured between the red dashed lines and the continuum band-passes between the dashed-dotted vertical lines. The line-strength measurements for these two lines in the uncorrected and corrected spectrum are for HγA = −4.79 ± 0.33 Å, and −5.07 ± 0.37 Å, and for Mg b = 5.33 ± 0.28 Å, and 5.25 ± 0.32 Å, respectively.
Current usage metrics show cumulative count of Article Views (full-text article views including HTML views, PDF and ePub downloads, according to the available data) and Abstracts Views on Vision4Press platform.
Data correspond to usage on the plateform after 2015. The current usage metrics is available 48-96 hours after online publication and is updated daily on week days.
Initial download of the metrics may take a while.