Fig. 5
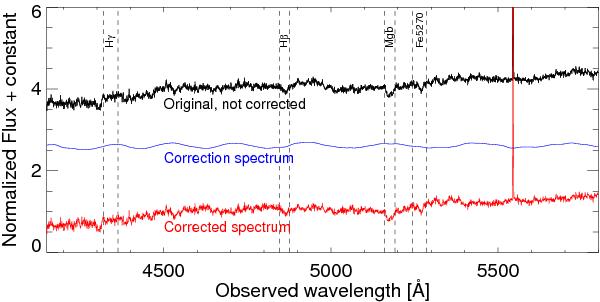
Example of the correction made for each individual spectrum. Here one of the most affected spectra for the galaxy NGC 3923 (not sky-subtracted) is shown. The top black spectrum represent the original spectrum at one spatial position. The middle blue spectrum shows the correction spectrum derived with our method. The bottom red spectrum shows the corrected spectrum. The black dashed vertical lines indicate the central bandpasses of the line-strength indices HγA, Hβ, Mg b, and Fe5270.
Current usage metrics show cumulative count of Article Views (full-text article views including HTML views, PDF and ePub downloads, according to the available data) and Abstracts Views on Vision4Press platform.
Data correspond to usage on the plateform after 2015. The current usage metrics is available 48-96 hours after online publication and is updated daily on week days.
Initial download of the metrics may take a while.