Fig. 10
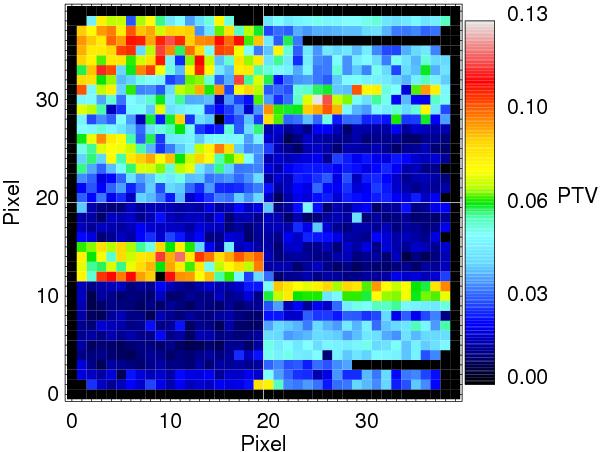
Spatial map of the maximum variations (PTV) in the correction spectra as derived from a flat-field and the wavelength range 5188−5620 Å. Regions with a strong fringe-like pattern are clearly visible and related to certain fibre models (see also Fig. 3). The white solid lines indicate the borders of the quadrants. The quadrants are positioned as shown in Fig. 2, bottom left panel.
Current usage metrics show cumulative count of Article Views (full-text article views including HTML views, PDF and ePub downloads, according to the available data) and Abstracts Views on Vision4Press platform.
Data correspond to usage on the plateform after 2015. The current usage metrics is available 48-96 hours after online publication and is updated daily on week days.
Initial download of the metrics may take a while.