Fig. 3
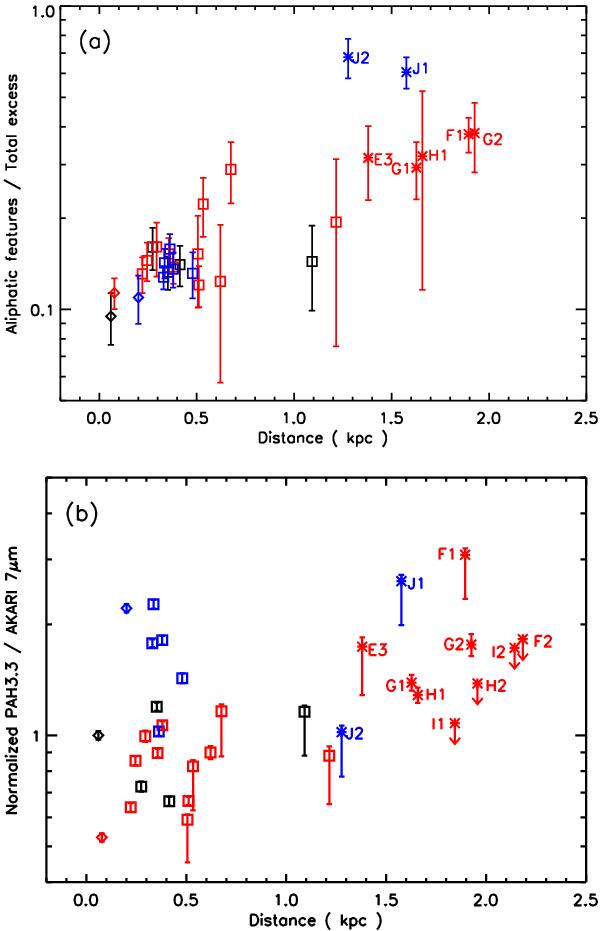
a) Ratio of the aliphatic features to the total excess (=aromatic + aliphatic features) flux plotted against the distance from the center of the galaxy. The data points in the halo are labeled with the region names. The diamonds, squares, and asterisks represent the regions in the center, disk, and halo, respectively. The colors of the symbols are changed depending on the location; the black for the on-plane (A3, B3, C3-4, and E1), blue for the north side (A1-2, B1-2, C1-2, and J1-2), and red for the south side from the galactic plane (A4-6, B4-6, C5-6, D1-3, E2-3, F1-2, G1-2, H1-2, and I1-2). b) Ratio of the aromatic 3.3 μm feature intensity to the AKARI 7 μm surface brightness (Kaneda et al. 2010) plotted against the distance from the center of the galaxy. The ratios are normalized to unity in the galactic center of region A3. The definition of the symbols and colors is the same as Fig. 3a. The data points with non-detection of the PAH 3.3 μm emission are shown with the 3σ upper limits.
Current usage metrics show cumulative count of Article Views (full-text article views including HTML views, PDF and ePub downloads, according to the available data) and Abstracts Views on Vision4Press platform.
Data correspond to usage on the plateform after 2015. The current usage metrics is available 48-96 hours after online publication and is updated daily on week days.
Initial download of the metrics may take a while.