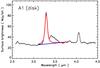
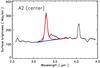
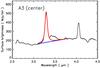
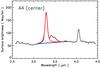
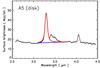
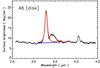
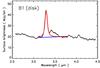
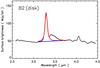
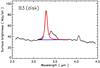
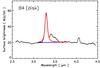
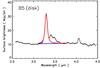
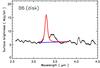
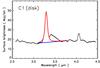
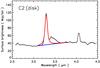
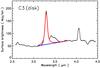
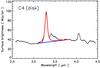
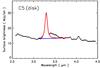
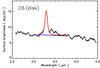
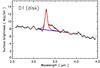
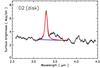
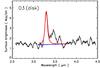
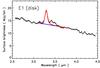
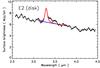
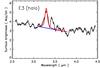
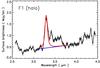
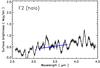
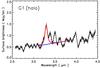
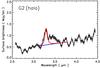
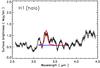
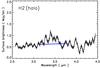
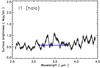
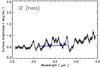
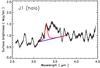
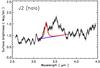
Fig. 2
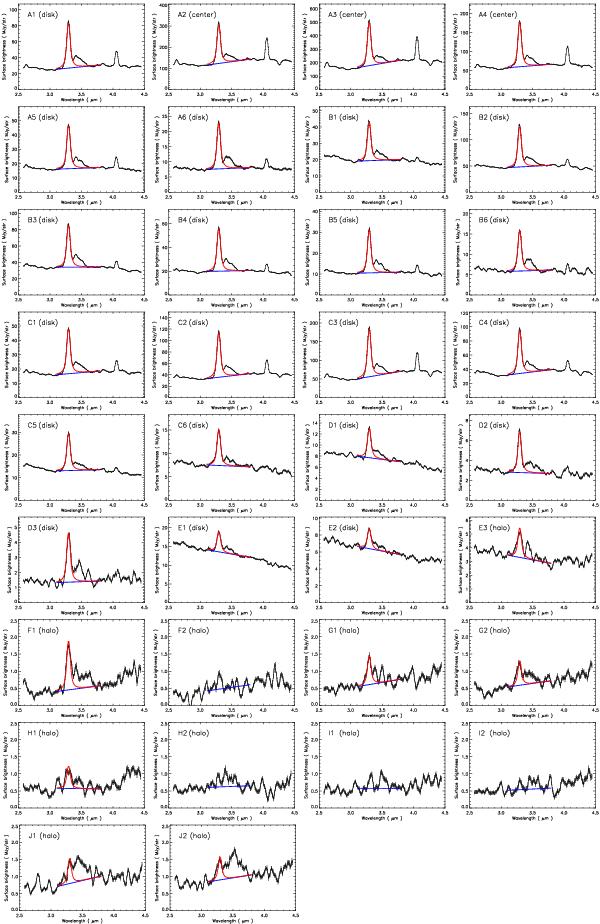
AKARI 2.5–4.5 μm spectra taken from the 34 regions in M 82, the positions of which are shown in Fig. 1. The blue linear baselines are determined at the wavelength ranges of 3.0–3.2 μm and 3.7–3.9 μm. For the spectra with significant detection of the excess emission, the red curves indicate the best-fit Drude profiles representing the contribution of the aromatic 3.3 μm emission, which are determined at the wavelength range of 3.20–3.35 μm.
Current usage metrics show cumulative count of Article Views (full-text article views including HTML views, PDF and ePub downloads, according to the available data) and Abstracts Views on Vision4Press platform.
Data correspond to usage on the plateform after 2015. The current usage metrics is available 48-96 hours after online publication and is updated daily on week days.
Initial download of the metrics may take a while.