Fig. 1
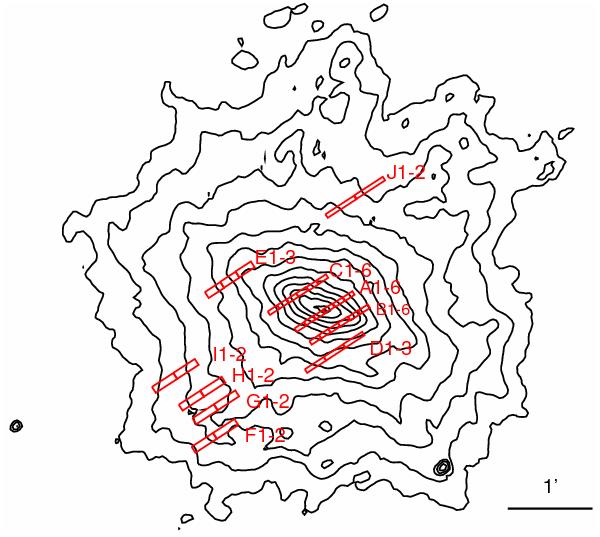
Positions of the sub-slit apertures used to derive the 34 spectra in Fig. 2, overlaid on the AKARI 7 μm band contour map (Kaneda et al. 2010). North is up and west to the right. The size of each box represents the area of each sub-slit aperture, which is listed in Table 1. The name of each region is indicated together, where the incremental order of the number is from the north to the south.
Current usage metrics show cumulative count of Article Views (full-text article views including HTML views, PDF and ePub downloads, according to the available data) and Abstracts Views on Vision4Press platform.
Data correspond to usage on the plateform after 2015. The current usage metrics is available 48-96 hours after online publication and is updated daily on week days.
Initial download of the metrics may take a while.