Fig. 6
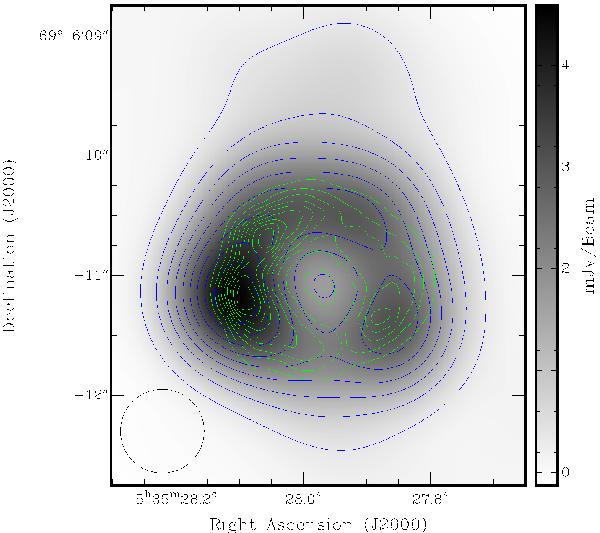
The 3-mm image of SNR 1987A from 2011 (greyscale and blue contours; the beam is plotted in the lower left corner), overlain with (green) contours of the average of the deconvolved 0.3–8 keV Chandra X-ray images from October 1999, January 2000 and December 2000 (Burrows et al. 2000; Park et al. 2002). Contours are between 10% and 90% with 10% intervals.
Current usage metrics show cumulative count of Article Views (full-text article views including HTML views, PDF and ePub downloads, according to the available data) and Abstracts Views on Vision4Press platform.
Data correspond to usage on the plateform after 2015. The current usage metrics is available 48-96 hours after online publication and is updated daily on week days.
Initial download of the metrics may take a while.