Fig. 5
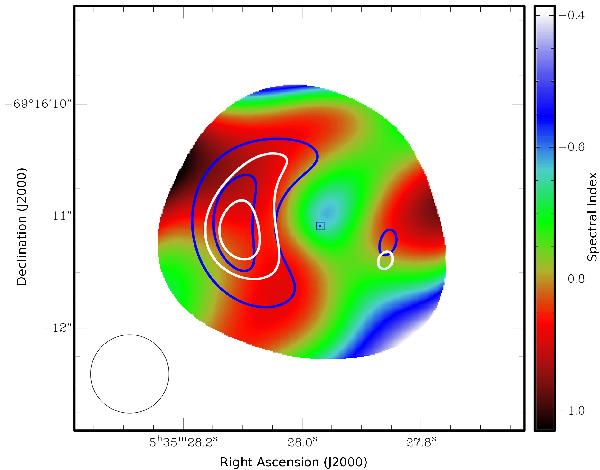
3-mm – 3-cm spectral index image. The spectral index α is defined as Sν ∝ να and was determined from the ratio of the 3-cm image from observations performed on 2011 January 25 (Ng. et al., in prep.) and the 3-mm image from observations around July 2011. Both images were restored on a 0.′′7 circular beam and centred on the VLBI position of SN 1987A determined by Reynolds et al. (1995) (blue square). The images are overlaid with contours representing the 70% and 90% flux density levels (white: 3 mm; blue: 3 cm).
Current usage metrics show cumulative count of Article Views (full-text article views including HTML views, PDF and ePub downloads, according to the available data) and Abstracts Views on Vision4Press platform.
Data correspond to usage on the plateform after 2015. The current usage metrics is available 48-96 hours after online publication and is updated daily on week days.
Initial download of the metrics may take a while.