Fig. 3
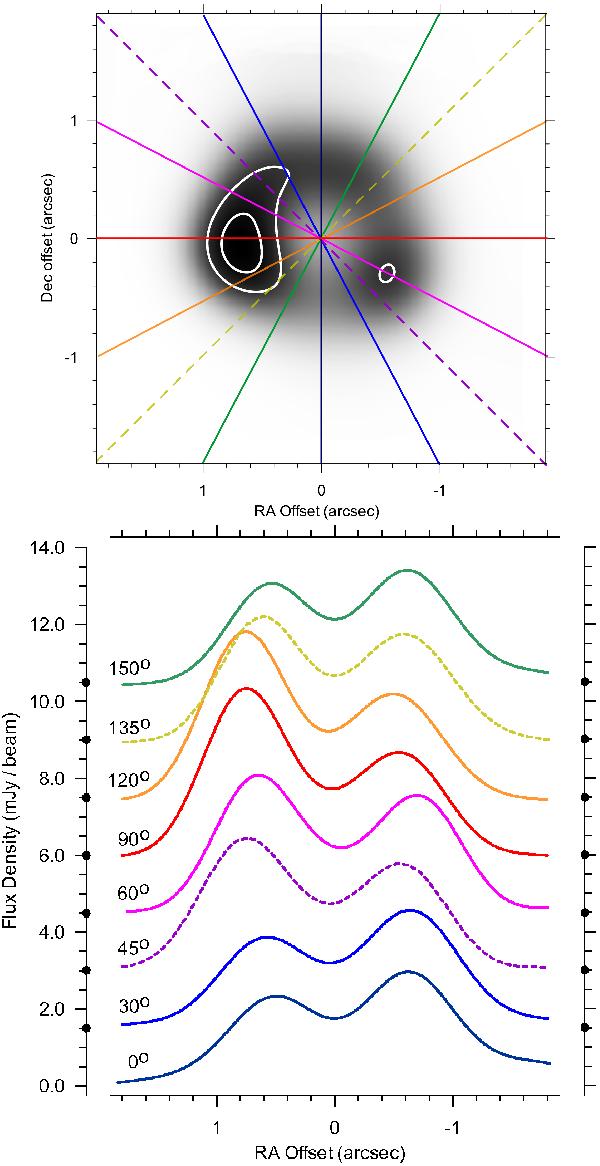
Radial slices through the 3-mm image at 8 position angles. Black dots on vertical axes indicate the position of the zero for each slice. The top image is overlaid with the 70% and 90% flux-density levels (white contours). The image centre was shifted to the VLBI position of SN 1987A determined by Reynolds et al. (1995) [RA 05h35m27.s968, Dec −69°16′11.′′09 (J2000)].
Current usage metrics show cumulative count of Article Views (full-text article views including HTML views, PDF and ePub downloads, according to the available data) and Abstracts Views on Vision4Press platform.
Data correspond to usage on the plateform after 2015. The current usage metrics is available 48-96 hours after online publication and is updated daily on week days.
Initial download of the metrics may take a while.