Fig. 7
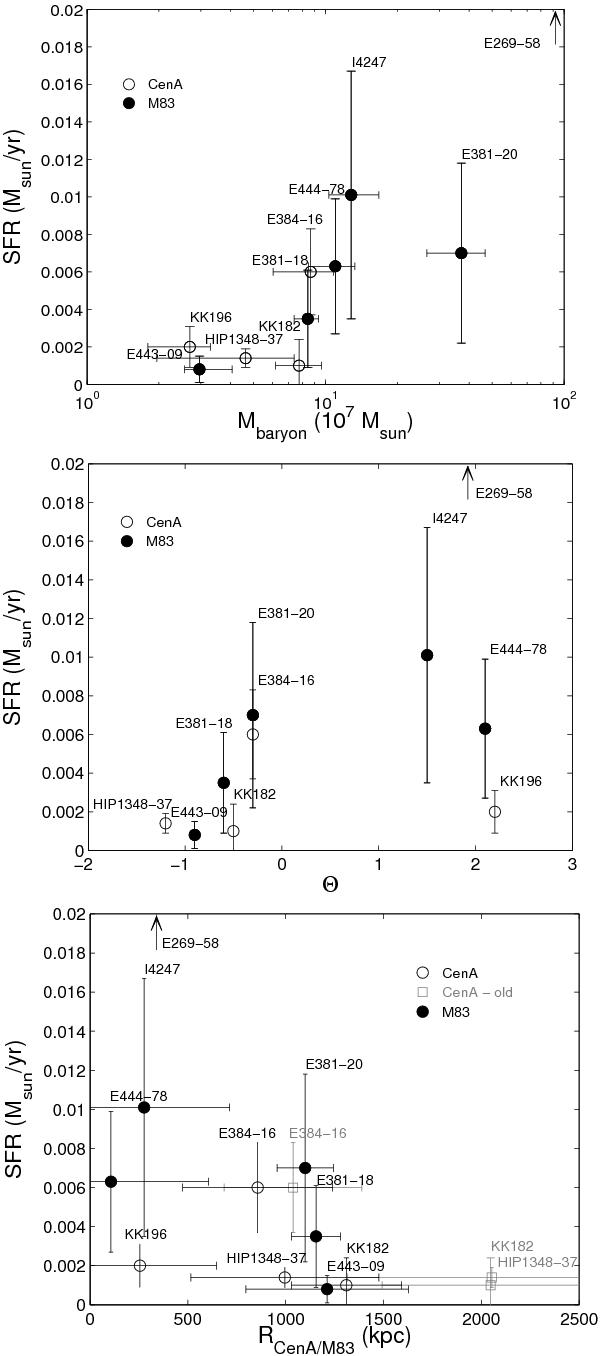
Lifetime average star formation rate plotted as a function of (top panel) baryonic mass (=Mstar + Mgas), (central panel) tidal index, and (bottom panel) deprojected distance from the dominant subgroup galaxy. The black open circles represent the CenA subgroup late-type dwarfs, while the black filled circles are M 83 subgroup members (data taken from Crnojević et al. 2011a). In the bottom panel, grey squares indicate the old distances for three of the CenA subgroup members, while black open circles for the same galaxies are new distances that we recompute because they are actually closer to M 83 than to CenA (see text for details). For ESO269-58, the SFR is much higher than those for the other objects (~0.07 ± 0.04 M⊙ yr-1), so this value falls outside our plot limits. In the panels, we only indicate its luminosity/tidal index/deprojected distance values with an arrow.
Current usage metrics show cumulative count of Article Views (full-text article views including HTML views, PDF and ePub downloads, according to the available data) and Abstracts Views on Vision4Press platform.
Data correspond to usage on the plateform after 2015. The current usage metrics is available 48-96 hours after online publication and is updated daily on week days.
Initial download of the metrics may take a while.