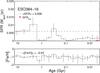
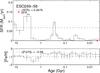
Fig. 3
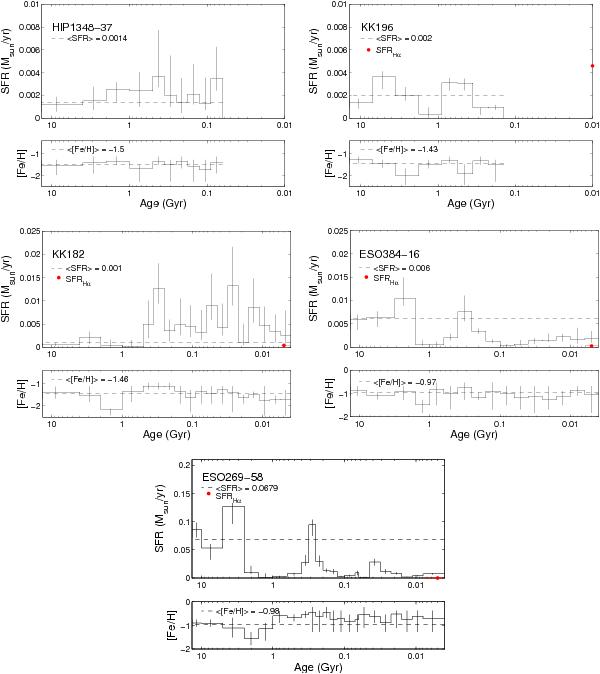
Upper panels: star formation histories derived for the five studied galaxies (HIPASS J1348-37, KK196, KK182, ESO384-016, and ESO269-58, ordered by increasing absolute magnitude). For each galaxy, the star formation rate as a function of time is plotted, with the oldest age being on the left side and the most recent age bin on the right edge of the (logarithmic) horizontal axis. Note that the size of the age bins is variable due to the different amount of information obtainable from each CMD for each stellar evolutionary stage. For HIPASS J1348-37 and KK196, there is not enough information in the CMD to derive the SFR for ages in the past ~100 Myr). For KK182, ESO384-016, and ESO269-58, the CMDs allow us to derive the SFR for ages younger than 10 Myr. Also note the different vertical axis scales. The black dashed line indicates the mean star formation rate over the galaxy’s lifetime. The red dots (for all the galaxies but for HIPASS J1348-37) report the current star formation rate derived in the literature from their Hα emission (often confined to a few individual HII regions). Lower panels: metallicity as a function of time, with the same x-axes as above. The black dashed line represents the mean metallicity over the galaxy’s lifetime. Note that the metallicity evolution is poorly constrained.
Current usage metrics show cumulative count of Article Views (full-text article views including HTML views, PDF and ePub downloads, according to the available data) and Abstracts Views on Vision4Press platform.
Data correspond to usage on the plateform after 2015. The current usage metrics is available 48-96 hours after online publication and is updated daily on week days.
Initial download of the metrics may take a while.