Fig. 10
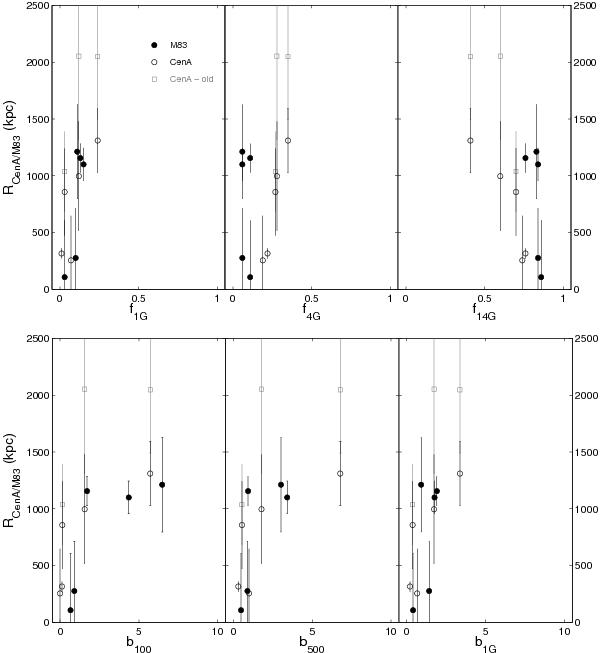
Deprojected distance from the dominant subgroup galaxy (either CenA or M 83) plotted as a function of: (upper panel) the fraction of stars formed in the past 0–1 Gyr (f1G), 1–4 Gyr (f4G) and 4–14 Gyr (f14G); (lower panel) the ratio of SFR to the lifetime average SFR over the last 100 Myr (b100), 500 Myr (b500) and 1 Gyr (b1G). The black open circles represent the CenA subgroup late-type dwarfs and the black filled circles are M 83 subgroup members. Grey squares indicate the old distances for three of the CenA subgroup members, while black open circles for the same galaxies are new distances that we recompute because they are actually closer to M 83 than to CenA (see also Fig. 7).
Current usage metrics show cumulative count of Article Views (full-text article views including HTML views, PDF and ePub downloads, according to the available data) and Abstracts Views on Vision4Press platform.
Data correspond to usage on the plateform after 2015. The current usage metrics is available 48-96 hours after online publication and is updated daily on week days.
Initial download of the metrics may take a while.