Fig. 2
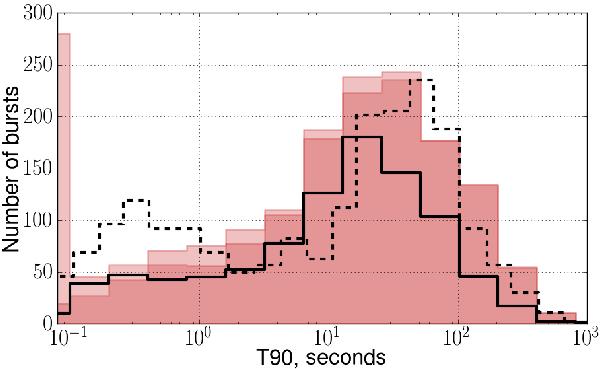
Distributions of the T90 durations. Dark and light shadings of the filled region correspond to 5 and 3 sigma confidence level for the event not being a spike. Solid black curve is for the confirmed bursts. The distribution of durations of GRBs from BATSE 4B GRB sample, scaled to match the normalization of the ACS sample, is shown by the black dashed line.
Current usage metrics show cumulative count of Article Views (full-text article views including HTML views, PDF and ePub downloads, according to the available data) and Abstracts Views on Vision4Press platform.
Data correspond to usage on the plateform after 2015. The current usage metrics is available 48-96 hours after online publication and is updated daily on week days.
Initial download of the metrics may take a while.