Free Access
Fig. 5
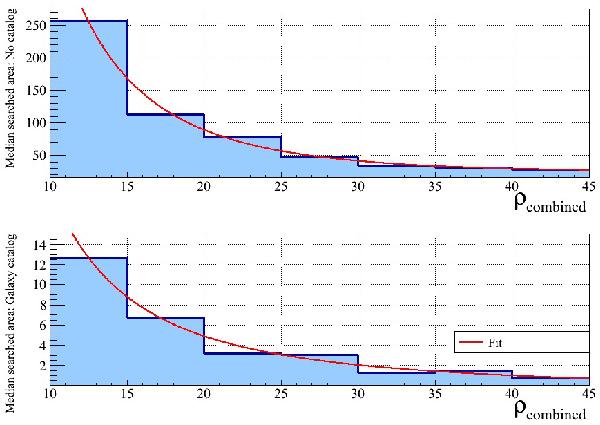
Sky localization performance as a function of combined signal-to-noise ratio with and without the use of a galaxy catalog (bottom and top panel, respectively). The blue bars indicate the median searched area, in square degrees, in each bin and the red lines depict a fit to these values.
Current usage metrics show cumulative count of Article Views (full-text article views including HTML views, PDF and ePub downloads, according to the available data) and Abstracts Views on Vision4Press platform.
Data correspond to usage on the plateform after 2015. The current usage metrics is available 48-96 hours after online publication and is updated daily on week days.
Initial download of the metrics may take a while.