Fig. 4
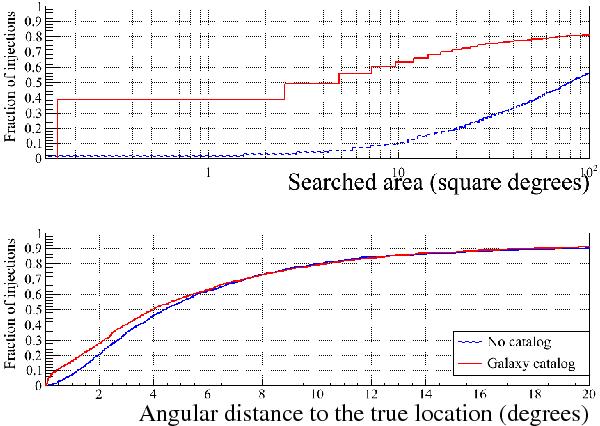
Sky localization performance with and without the use of a galaxy catalog. The upper pane shows a cumulative histogram of the searched area in square degrees. The lower pane is a cumulative histogram of the angular distance, in degrees, between the injected location and the maximum likelihood recovered location. In both plots the red solid line is the performance with the aid of the galaxy catalog and the blue dotted line is the performance without the galaxy catalog.
Current usage metrics show cumulative count of Article Views (full-text article views including HTML views, PDF and ePub downloads, according to the available data) and Abstracts Views on Vision4Press platform.
Data correspond to usage on the plateform after 2015. The current usage metrics is available 48-96 hours after online publication and is updated daily on week days.
Initial download of the metrics may take a while.