Fig. 9
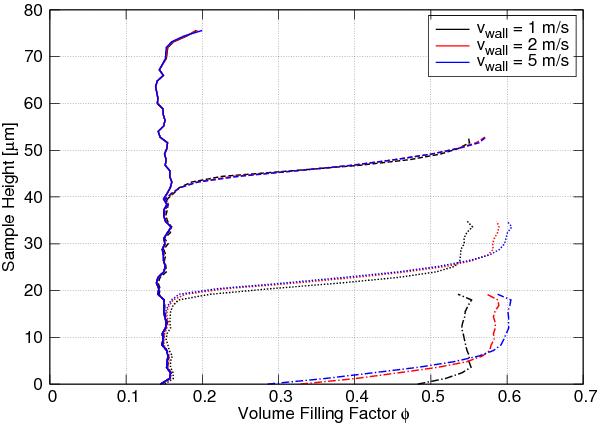
Snapshots of the vertical profile of the filling factor. As the top wall moves downwards rapidly the compaction of the lower parts of the aggregate is lagging behind. The color indicates the compression speed whereas the line type indicates the position of the top wall. The solid lines show the filling factor profile of the initial uncompressed sample.
Current usage metrics show cumulative count of Article Views (full-text article views including HTML views, PDF and ePub downloads, according to the available data) and Abstracts Views on Vision4Press platform.
Data correspond to usage on the plateform after 2015. The current usage metrics is available 48-96 hours after online publication and is updated daily on week days.
Initial download of the metrics may take a while.