Fig. 9
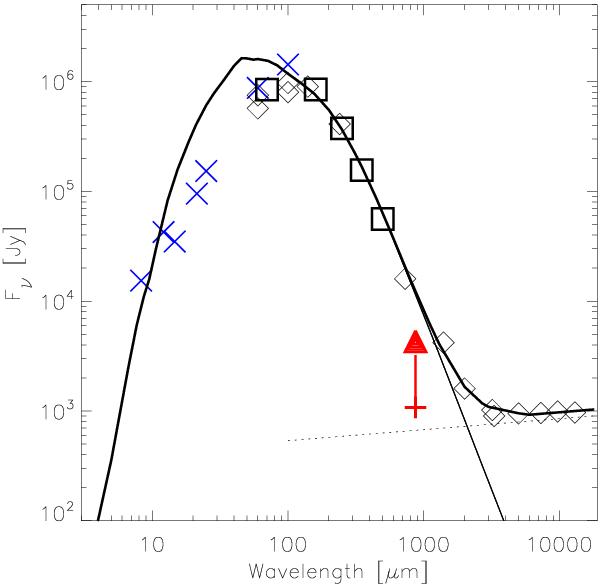
Spectral energy distribution of the Carina Nebula complex. The thick squares show the fluxes derived from our Herschel maps for a 1° radius area. The crosses show the mid- and far-infrared fluxes determined from the IRAS and MSX maps by Smith & Brooks (2007) for a very similar region. The cross with the upwards triangle shows the lower limit to the total 870 μm flux derived from our LABOCA map that covered the central 1.25° × 1.25° area. The diamond symbols show the fluxes taken from Salatino et al. (2012). The thick solid line is the sum of the spectrum resulting from the radiative transfer model and a power-law spectrum of the form  (following Salatino et al. 2012).
Current usage metrics show cumulative count of Article Views (full-text article views including HTML views, PDF and ePub downloads, according to the available data) and Abstracts Views on Vision4Press platform.
Data correspond to usage on the plateform after 2015. The current usage metrics is available 48-96 hours after online publication and is updated daily on week days.
Initial download of the metrics may take a while.