Free Access
Fig. 5
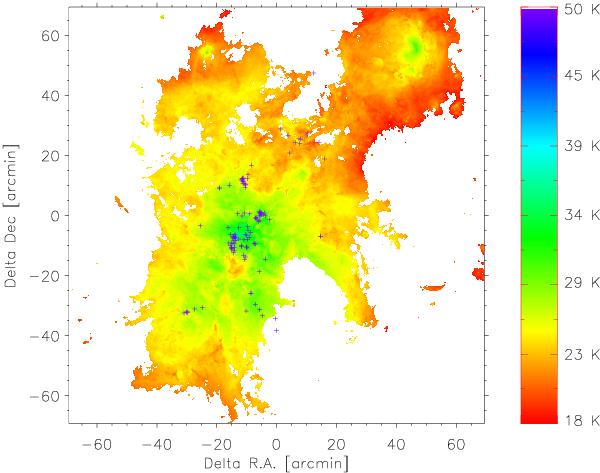
Map of 70–160 μm color-temperatures. Pixels with insufficient 70 μm or 160 μm intensities for a reliable determination of the intensity ratio are left white. The blue plus signs mark the locations of the high-mass stellar members of the CNC as listed in Smith (2006).
Current usage metrics show cumulative count of Article Views (full-text article views including HTML views, PDF and ePub downloads, according to the available data) and Abstracts Views on Vision4Press platform.
Data correspond to usage on the plateform after 2015. The current usage metrics is available 48-96 hours after online publication and is updated daily on week days.
Initial download of the metrics may take a while.