Free Access
Fig. 3
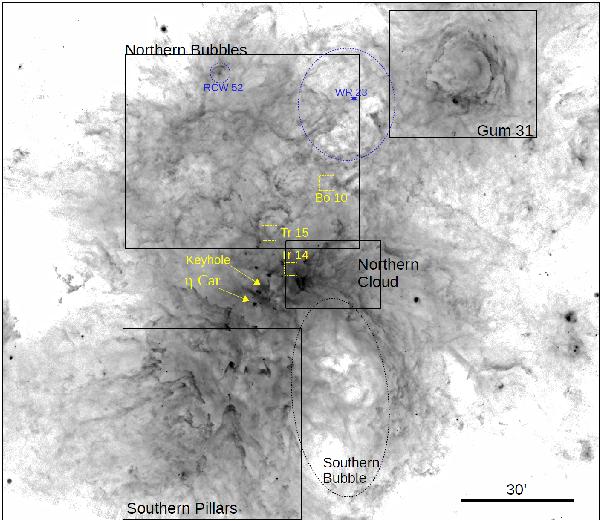
Unsharp-masked version of the Herschel 70 μm image with a logarithmic intensity scale image. The different regions mentioned in Sect. 3 are marked by the black boxes. The positions of η Car, the clusters Tr 14, Tr 14, and Bo 10, as well as the HII regions around WR 23 and RCW 52 are marked. North is up and east to the left.
Current usage metrics show cumulative count of Article Views (full-text article views including HTML views, PDF and ePub downloads, according to the available data) and Abstracts Views on Vision4Press platform.
Data correspond to usage on the plateform after 2015. The current usage metrics is available 48-96 hours after online publication and is updated daily on week days.
Initial download of the metrics may take a while.