Fig. 6
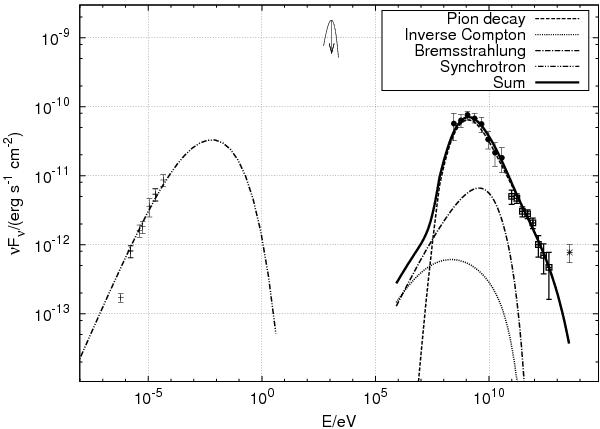
Model of the multi-wavelength SED in the hadronic-dominated scenario. The dashes with error bars are 21 cm radio continuum, circles represent Fermi/LAT data, squares are the data obtained in this work and the star represent the MILAGRO data point. The upper limit in the X-ray regime is obtained from ROSAT data as discussed in the text. The details of the scenario are discussed in the text.
Current usage metrics show cumulative count of Article Views (full-text article views including HTML views, PDF and ePub downloads, according to the available data) and Abstracts Views on Vision4Press platform.
Data correspond to usage on the plateform after 2015. The current usage metrics is available 48-96 hours after online publication and is updated daily on week days.
Initial download of the metrics may take a while.