Fig. 5
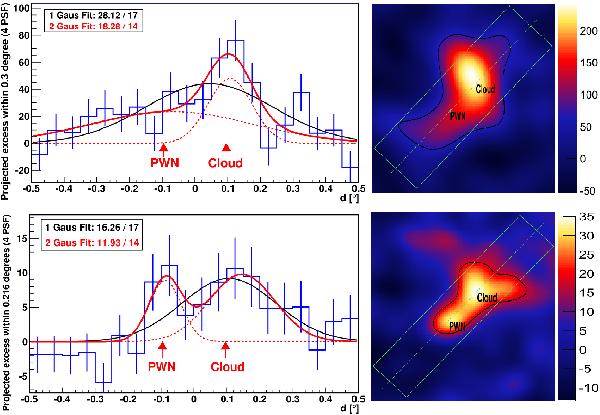
Projection of the excess inside the marked box in both differential sky maps: 300 GeV to 1000 GeV (top) and above 1000 GeV (bottom) along the line connecting the PWN and the shocked-gas region described in Koo & Moon (1997a,b). The projection is done with the unsmeared distribution. The excess is fitted with one (black) and two (red) Gaussian curves. The positions of the shocked gas and the PWN are marked with red arrows. On the right-hand side a sketch of the skymaps in both energy ranges is shown to illustrate the projected areas, as well as the position of the cloud and the PWN, respectively. The box has a length of 1° and a width of 4 Gaussian sigma of the instrumental PSF. The sky maps show the smeared excess (for comparison with Fig. 4) with the black contour representing the 3 TS contour.
Current usage metrics show cumulative count of Article Views (full-text article views including HTML views, PDF and ePub downloads, according to the available data) and Abstracts Views on Vision4Press platform.
Data correspond to usage on the plateform after 2015. The current usage metrics is available 48-96 hours after online publication and is updated daily on week days.
Initial download of the metrics may take a while.