Fig. 3
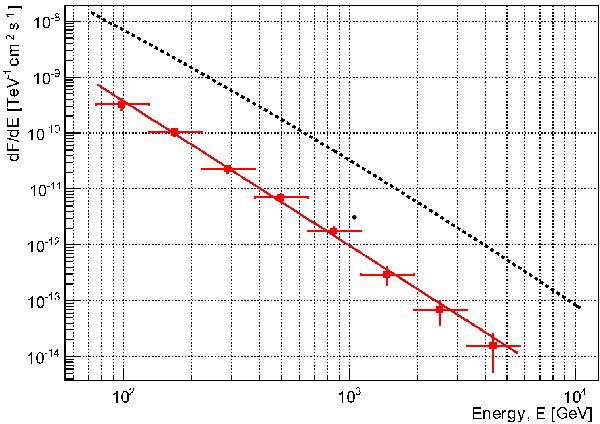
Differential energy spectrum of W51 obtained by MAGIC. The red points represent the differential flux points after unfolding. The red line represents a power law fit to the data. The error bars represent the statistical errors. For comparison, the dotted line represents the spectrum of the Crab Nebula as shown in Aleksić et al. (2012).
Current usage metrics show cumulative count of Article Views (full-text article views including HTML views, PDF and ePub downloads, according to the available data) and Abstracts Views on Vision4Press platform.
Data correspond to usage on the plateform after 2015. The current usage metrics is available 48-96 hours after online publication and is updated daily on week days.
Initial download of the metrics may take a while.